


29 March 2025
Turning Nostalgia into Art: How AI Brings Childhood Memories to Life
Childhood memories are treasures we hold close to our hearts, often reliving them through stories, photos, or cherished keepsakes. However, what if you could…
You're a business owner. You have a problem. You want to grow your business with digital marketing. But, you're not sure who to trust or which digital marketing agency can get you the results you want.

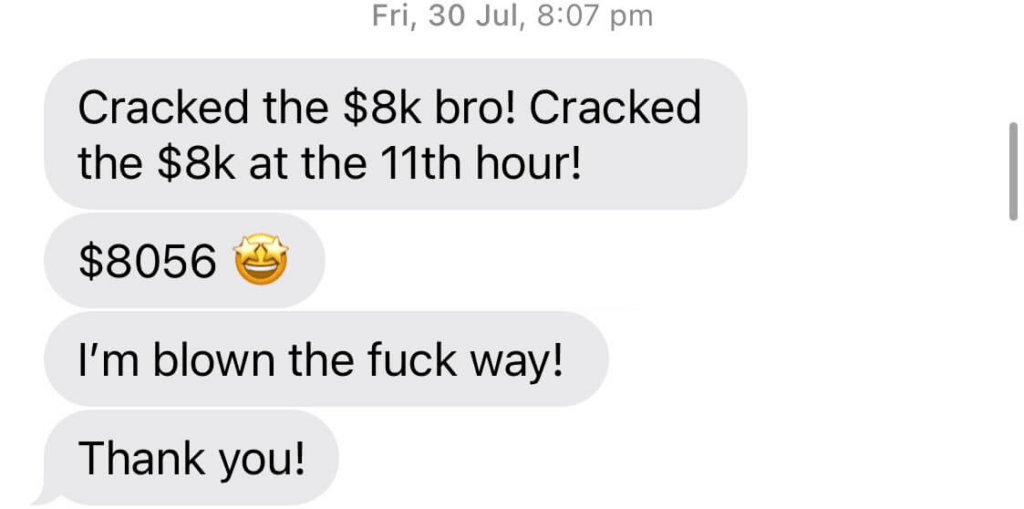
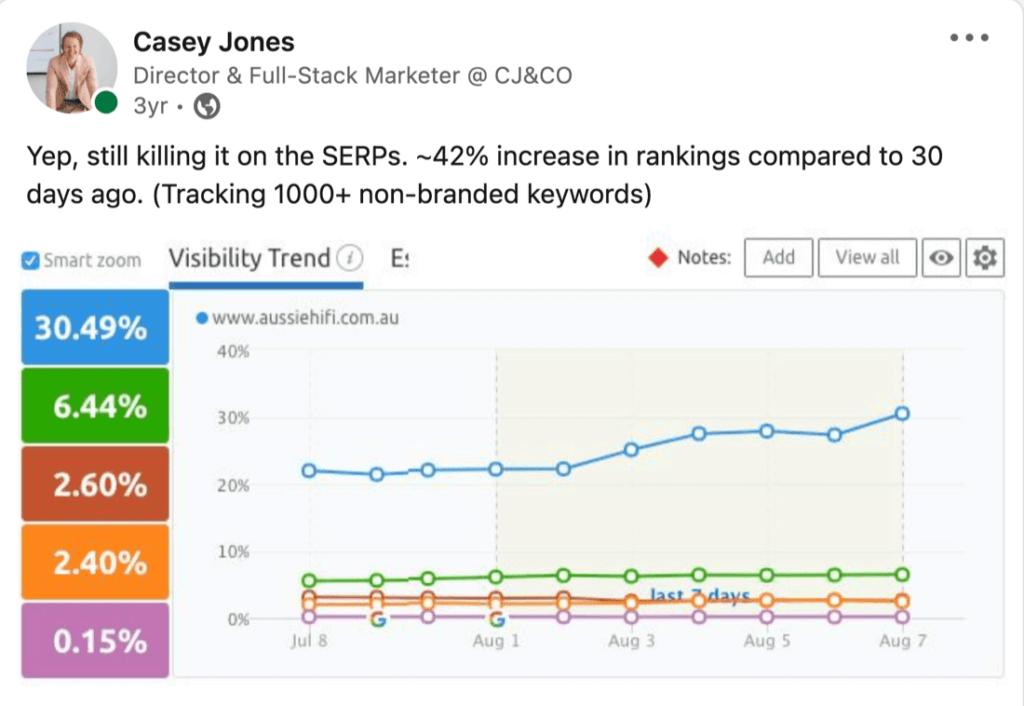
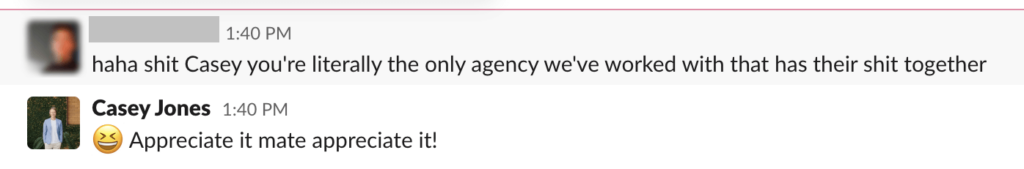
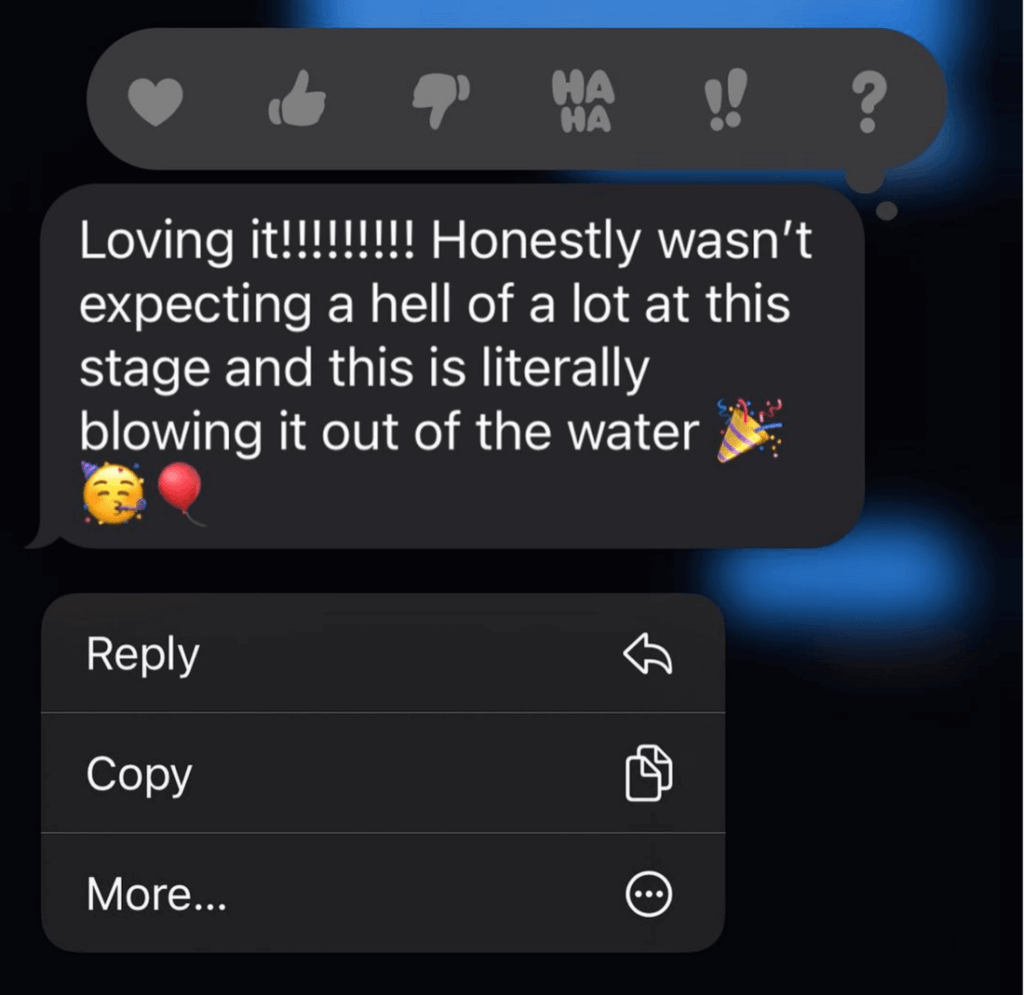
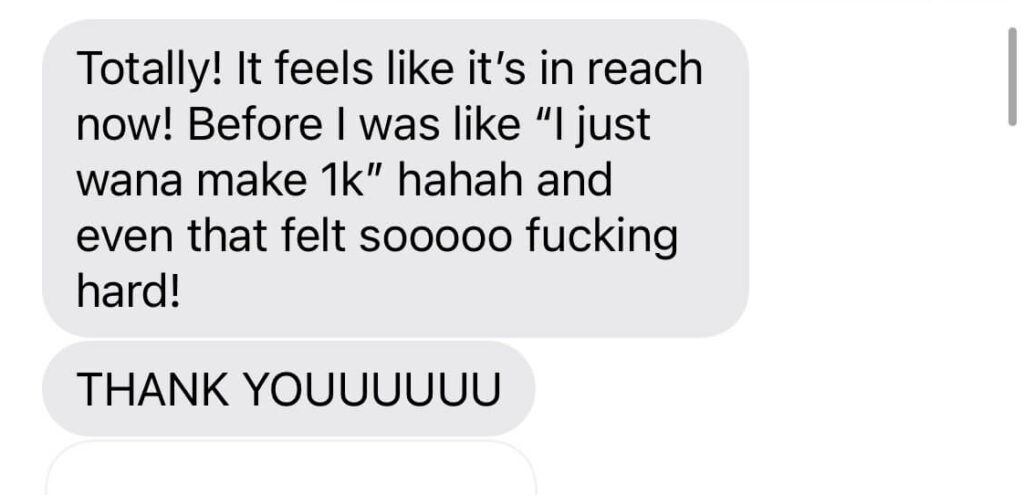
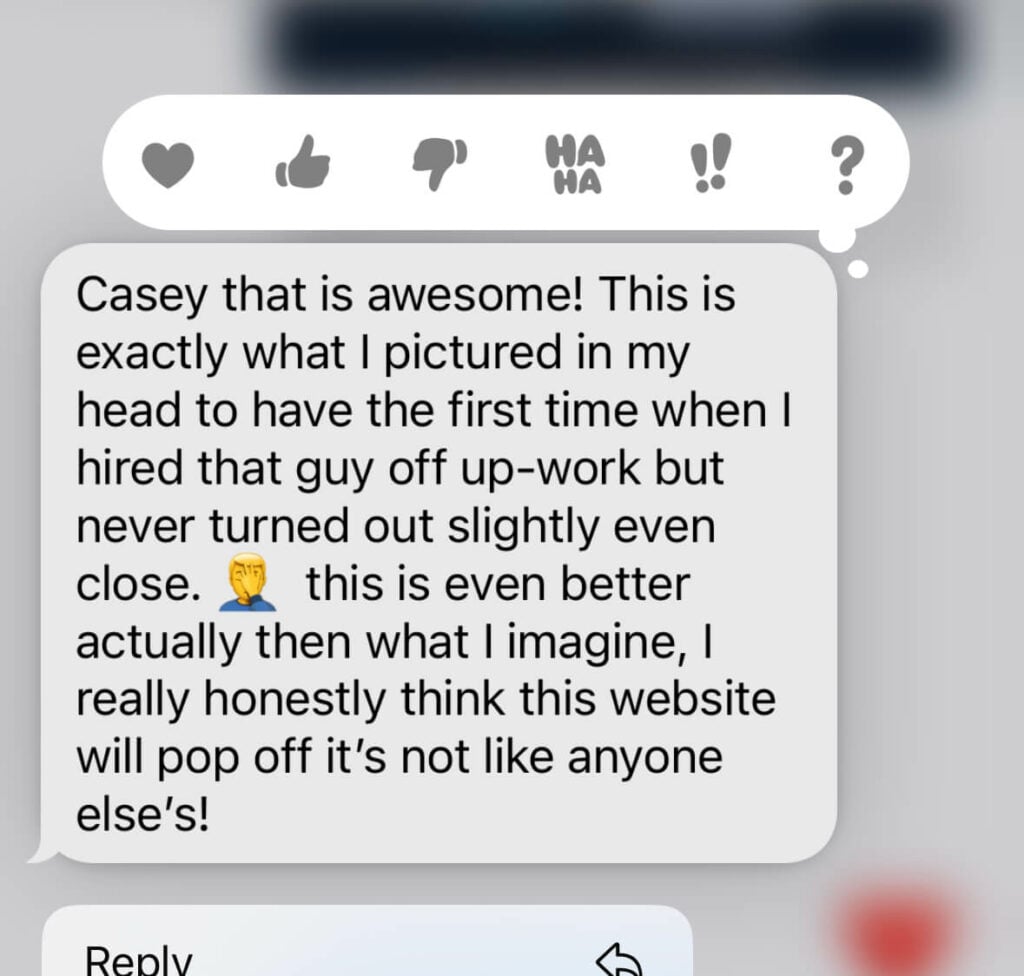
I'm blown the F*** away!
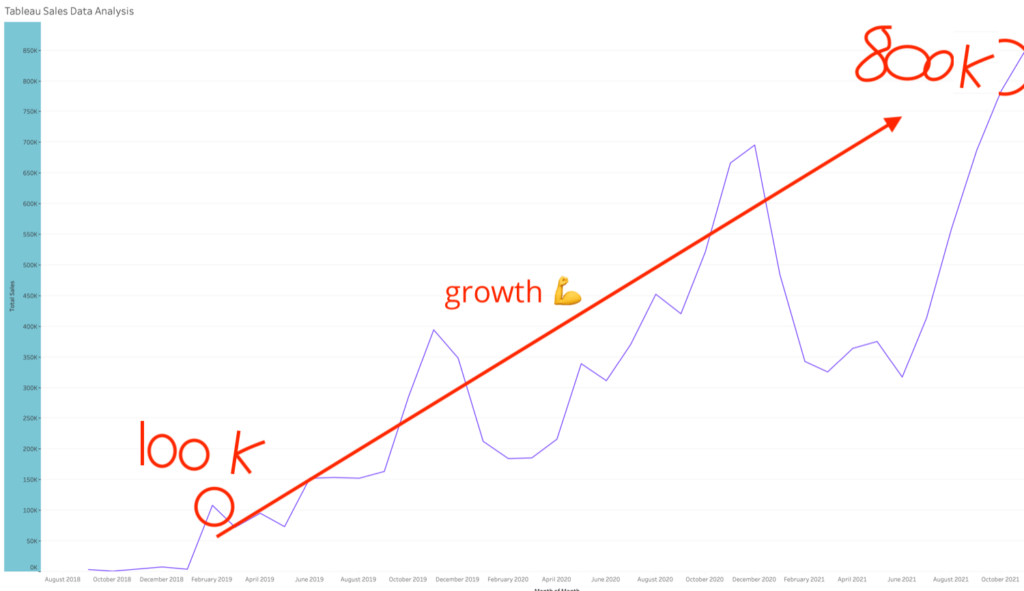
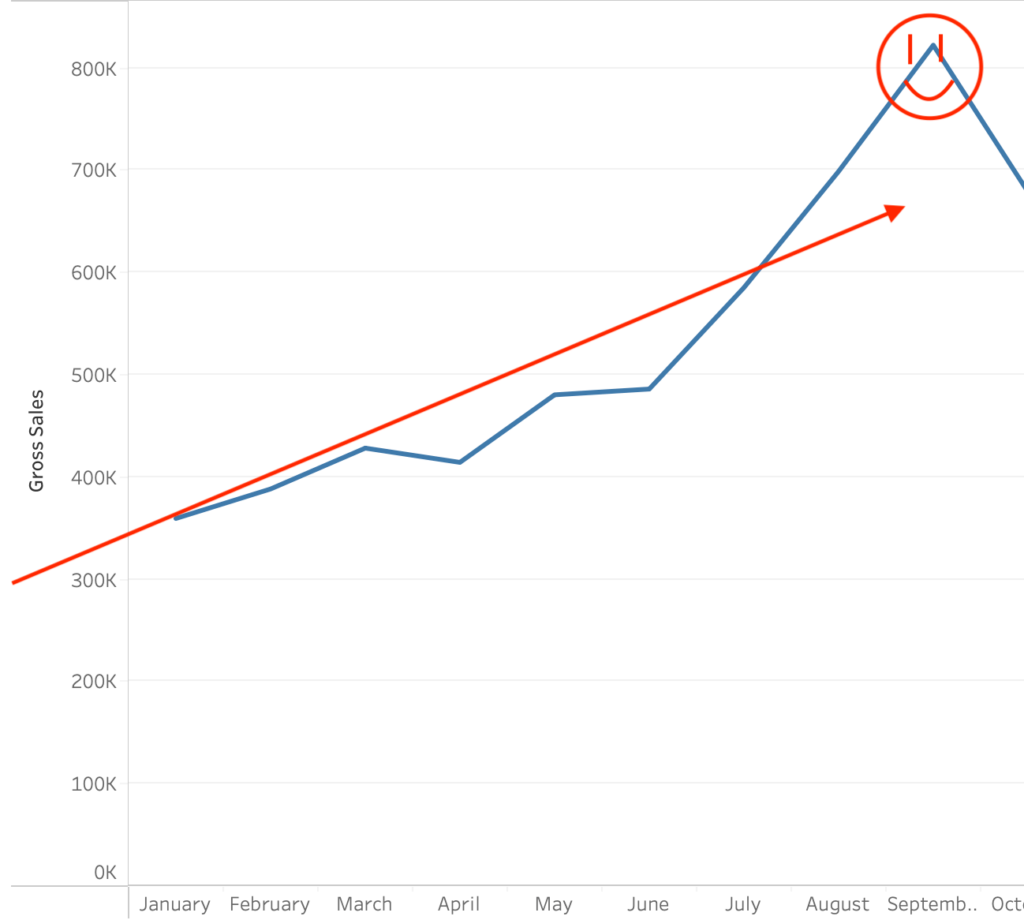
My business is thriving
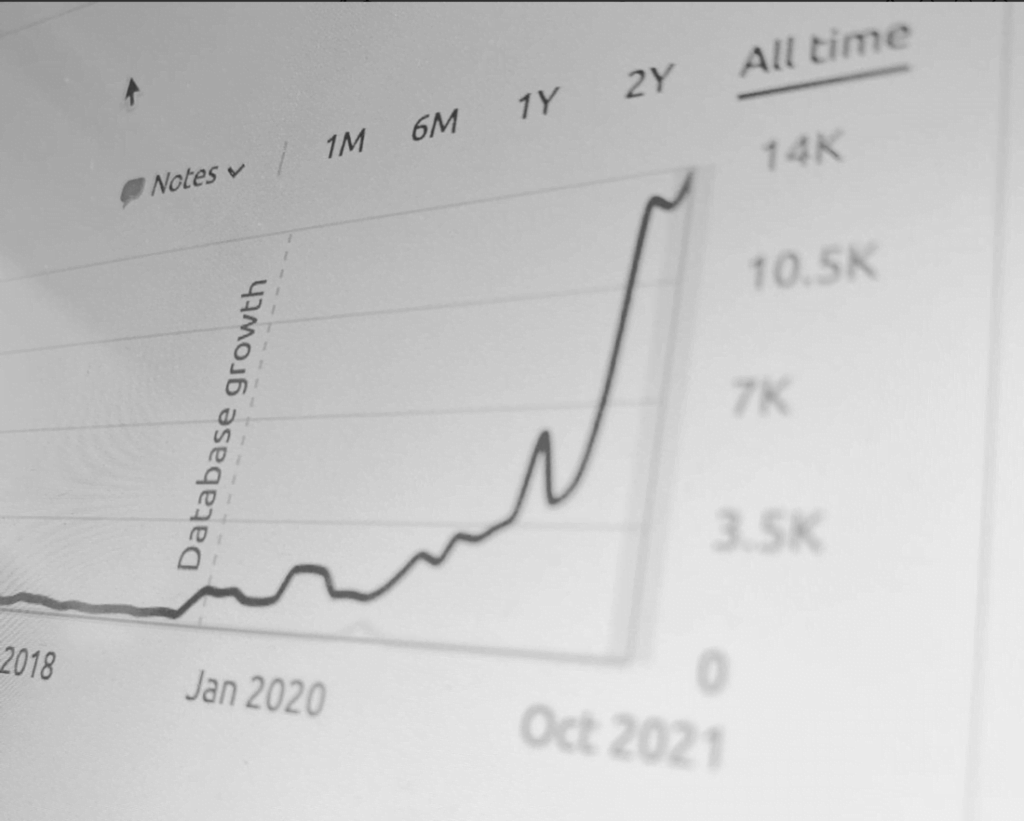
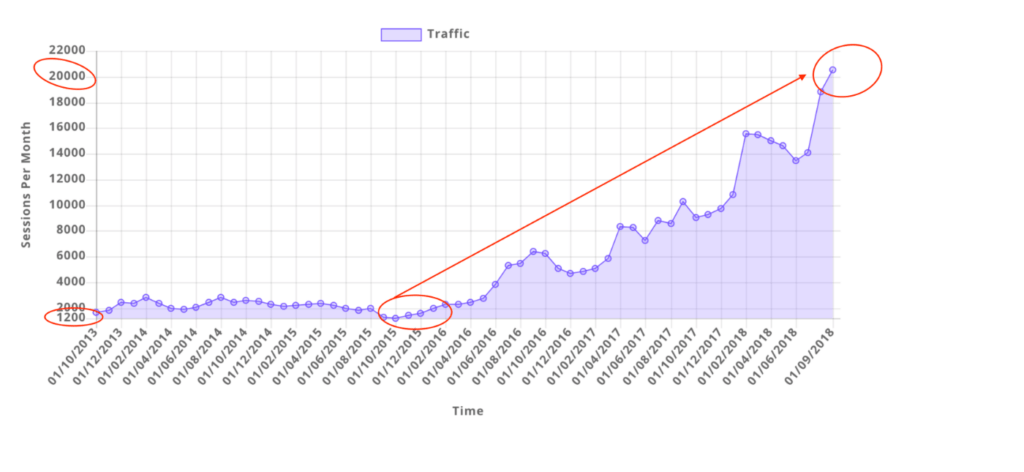
Single-handedly grown my business.

We're working with clients in the Asia-Pacific, the USA and UK. Driving results for businesses and government organisations across the globe.


With a team of (15+) seasoned experts, you can rest assured that your brand is in good hands. Our unparalleled skills, razor-sharp strategies, and relentless drive to deliver results are the weapons that set us apart. Get ready to experience a whole new level of growth and success with CJ&CO.
Digital Marketing
Advertising
Google Ads
Facebook Ads
Instagram Ads
TikTok
Social Media Marketing
UGC Social Proof
Ecommerce
Web Design
Web Development
Copywriting
Content Marketing
Google Optimisation
SEO
Landing Pages
Graphic Design
Photography
Videography
Email Marketing
Shopify
Wordpress
Conversion Rate Optimisation
Up until working with Casey, we had only had poor to mediocre experiences outsourcing work to agencies. Casey & the team at CJ&CO are the exception to the rule.
Communication was beyond great, his understanding of our vision was phenomenal, and instead of needing babysitting like the other agencies we worked with, he was not only completely dependable but also gave us sound suggestions on how to get better results, at the risk of us not needing him for the initial job we requested (absolute gem).
This has truly been the first time we worked with someone outside of our business that quickly grasped our vision, and that I could completely forget about and would still deliver above expectations.
I honestly can’t wait to work in many more projects together!
babybub
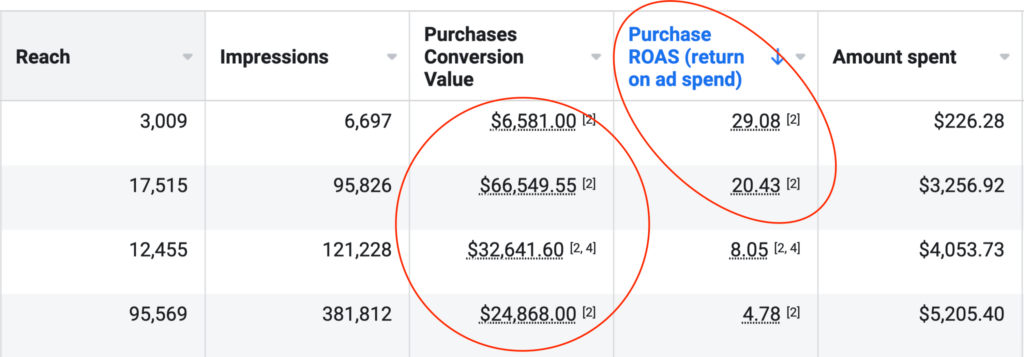
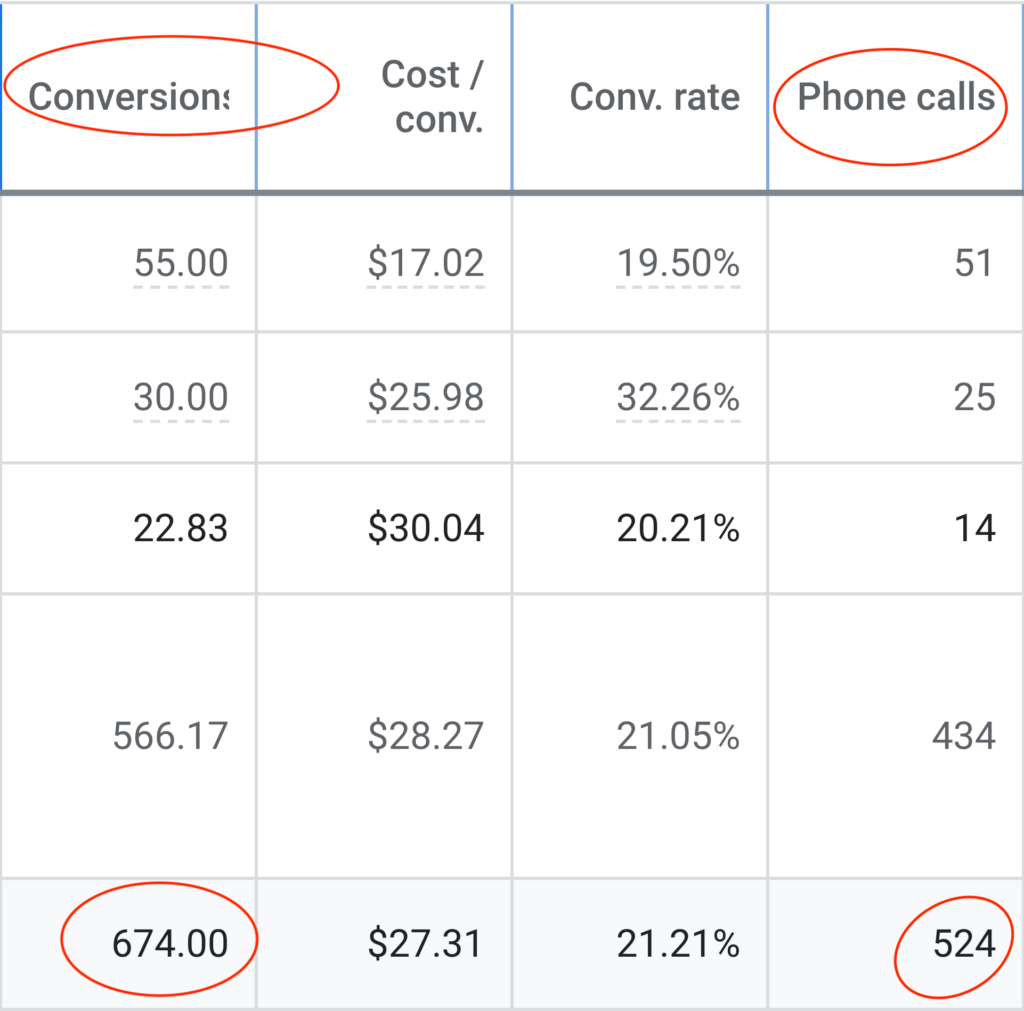
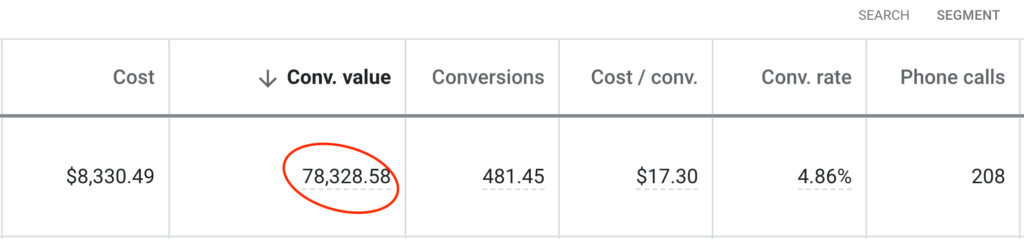
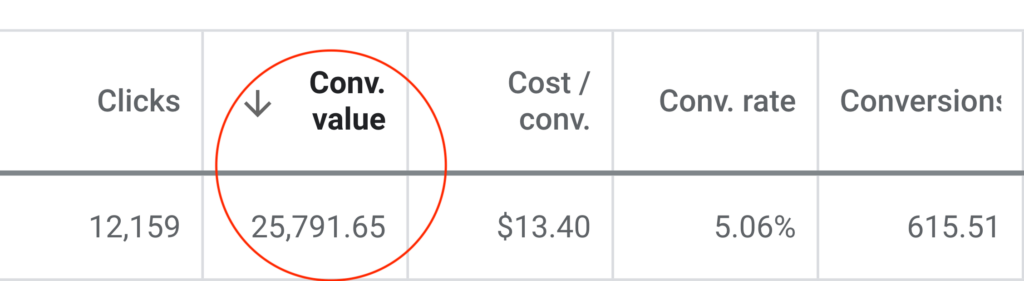
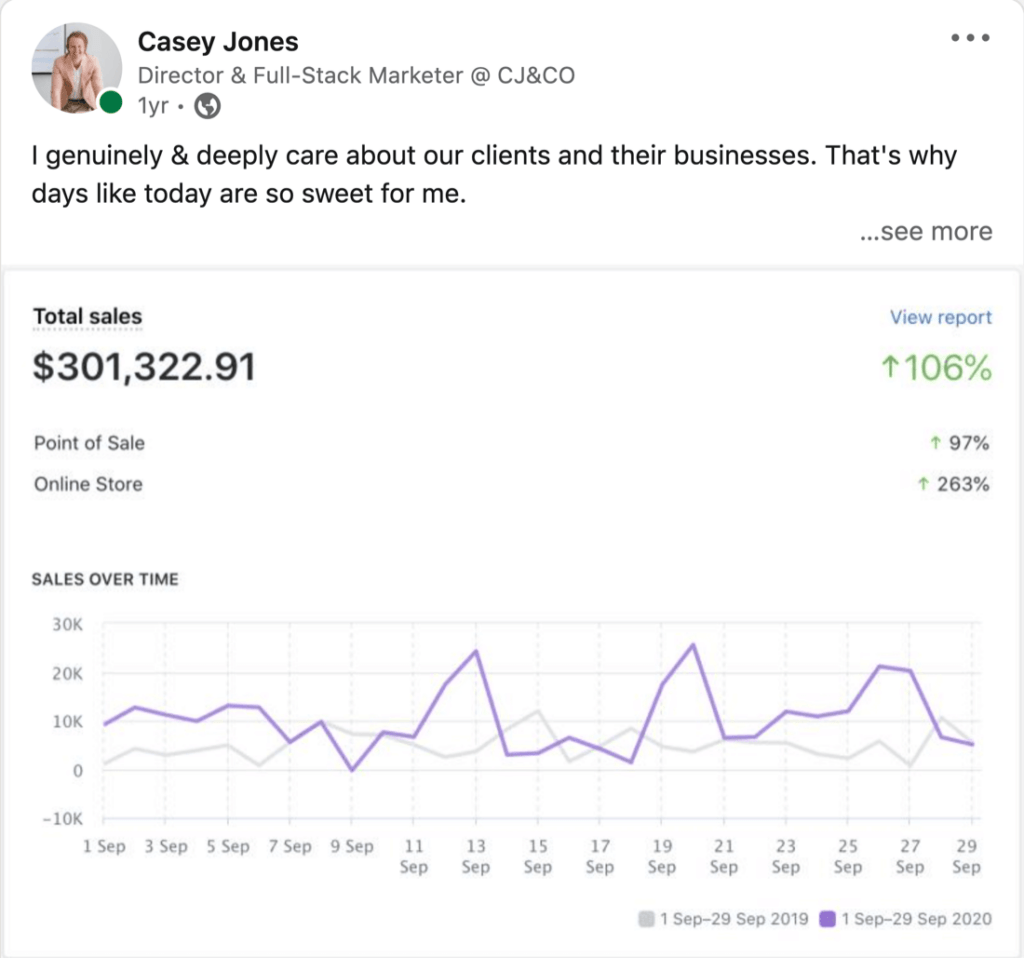
Reported Client Revenue
5 Star Rated Agency
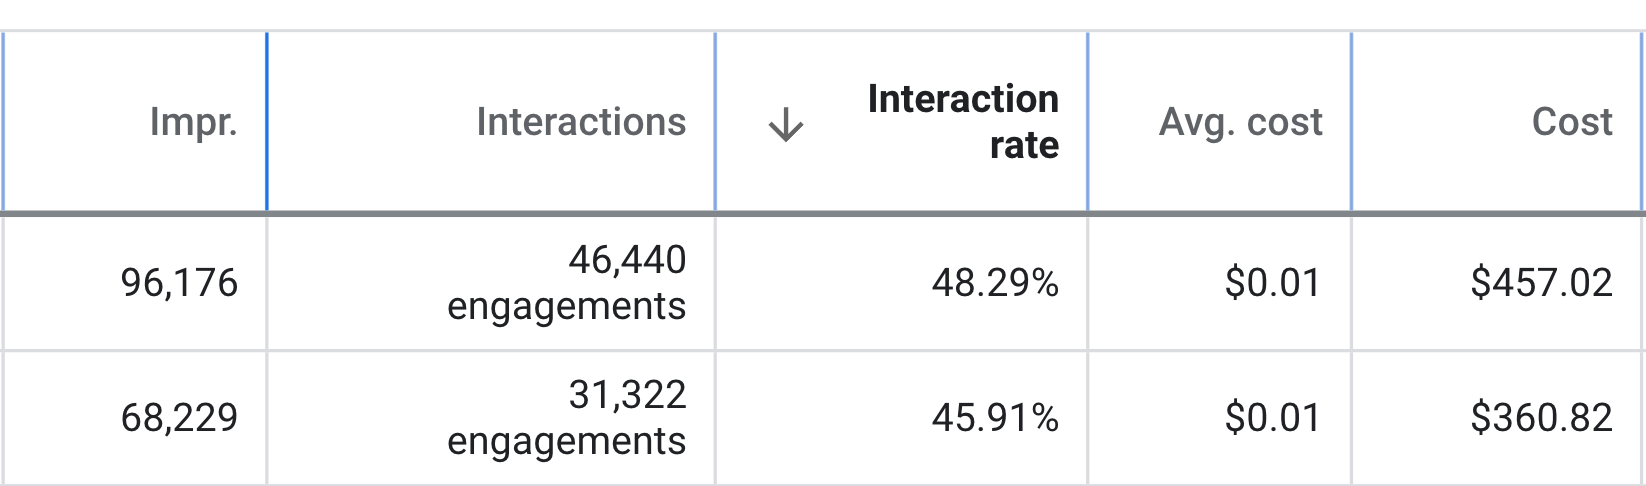
In Ad Spend
And Growing Fast!
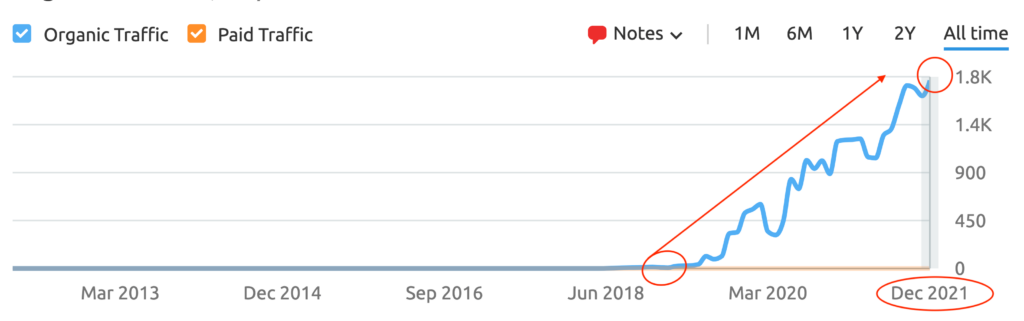
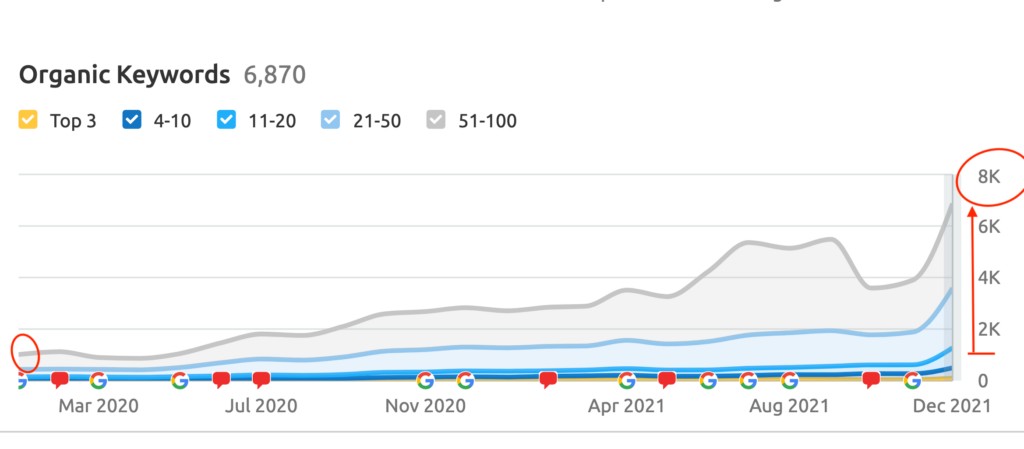
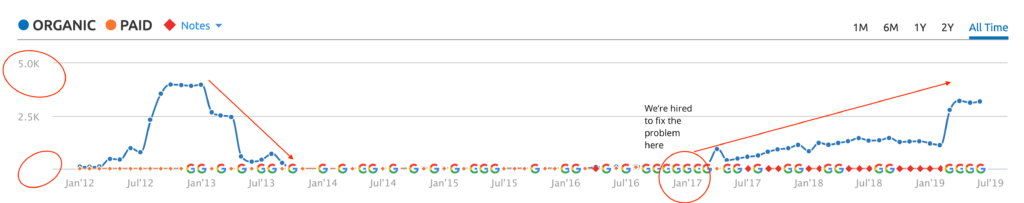
Keywords Ranked On Page #1 of Google
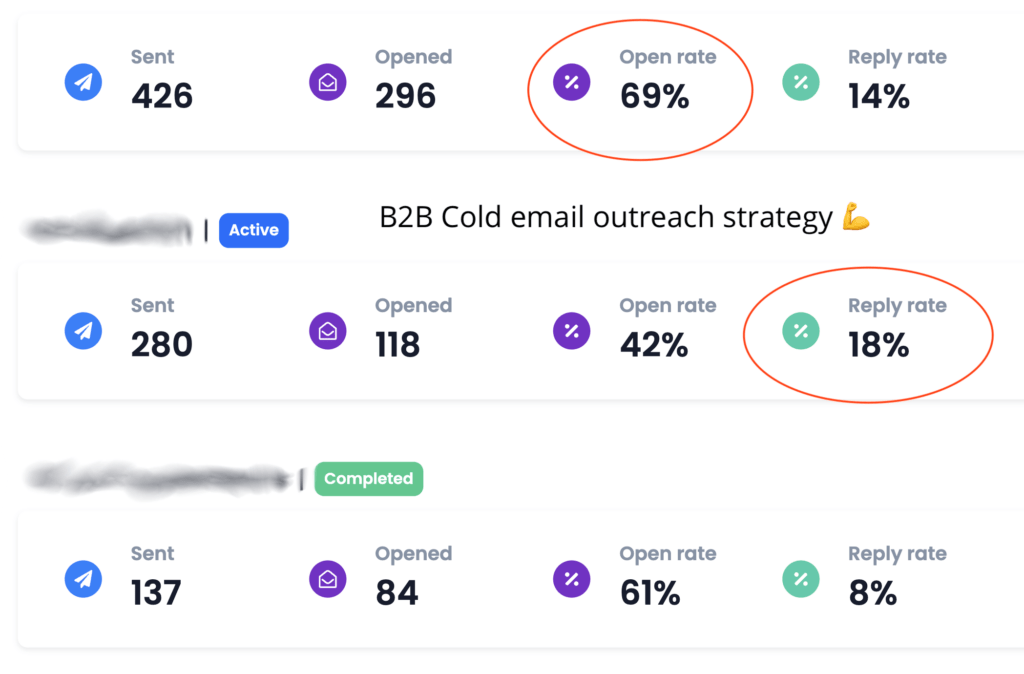
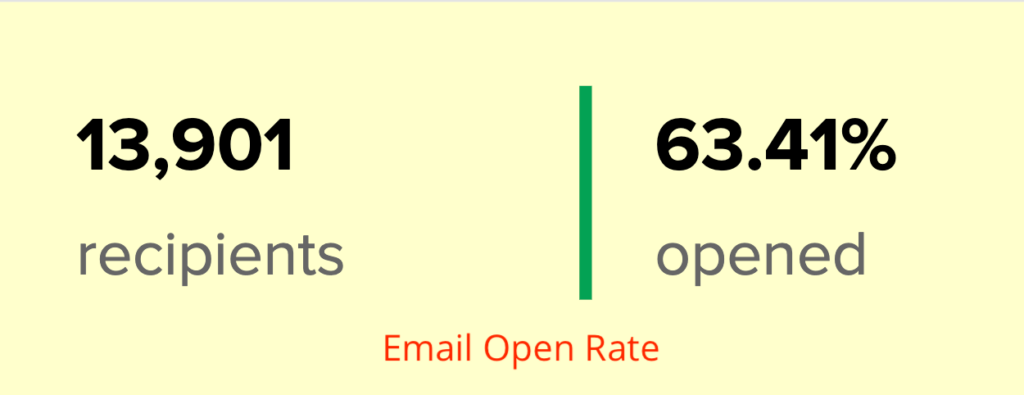
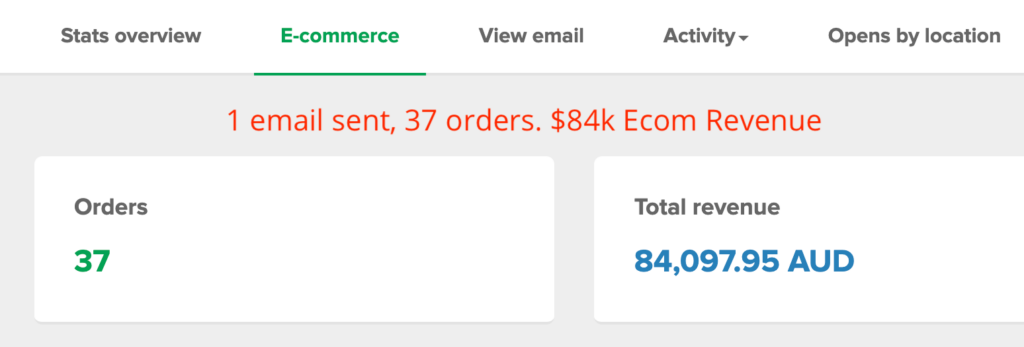
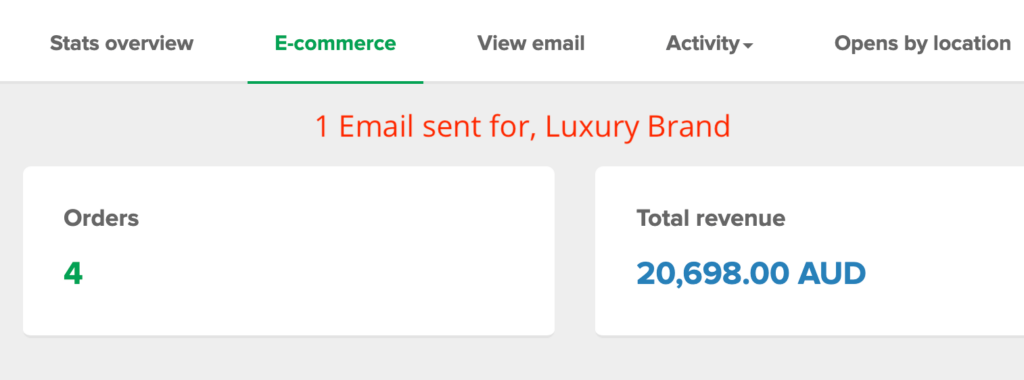
Generated from Email Marketing
Kickass Results, No BS
A Squad of 15+ Badass Experts
10,000+ Google Page #1 Dominations
$175,000,000 Smashed in Client Revenue
You, my friend, are on a mission to amp up your digital marketing prowess.
We, the CJ&CO crew, are a bunch of battle-hardened pros with 70+ years under our belts, and damn, do we have the results to back that up.
Our passion? SMBs like yours. We’re all about crafting award-winning outcomes that send businesses soaring sky-high. Our squad won’t rest until we’ve built a bespoke plan to hit your unique goals, squeezing every last penny out of your ad and promo budget.
CJ&CO is where it’s at when you’re after custom solutions to the one-of-a-kind hurdles of this breakneck tech landscape. We’ve got a stellar rep for boosting businesses’ market shares, so you can bet your bottom dollar we’ll dish up innovative and potent strategies.
And, let me spill the beans – when you team up with CJ&CO, you’re not just snagging a posse of experts, you’re bagging the wisdom and know-how of the main man, Casey Jones. As your account maestro, Casey’s industry experience and knowledge buffet is all yours, guaranteeing the best advice and tactics for your biz.
Let’s talk. At CJ&CO, we don’t dig ghosting clients or lurking behind a receptionist. We get off on personal touchpoints and keeping you in the know every damn step.
With CJ&CO, you can kiss goodbye to being left clueless. Our team’s on standby to field your questions, dish out updates, and work side-by-side with you to smash your goals. We’re here to be your ride-or-die partner, and it all starts with flinging those communication doors wide open.
Hey there, I’m Casey Jones.
Let me ask you something…
Is your marketing delivering the ROI it should? Are you confident you’re capturing every opportunity in your market?
Or are you watching competitors gain ground while your growth plateaus?
Markets are more volatile than ever.
Customer acquisition costs are soaring. Digital landscapes shift weekly. And your marketing needs to work harder than ever before.
The fragmented digital landscape. Rising ad costs eating into profitability. Complex customer journeys that need constant optimisation.
And marketing teams stretched too thin.
If you’re nodding along, you’re not alone.
Whether you’re leading a growing business ready to scale, an established company seeking better returns, or an enterprise expanding market share, you’re likely facing similar challenges.
Your current agency lacks strategic depth.
(or they just seem to slide into the bushes when you try and call them)
Your in-house team needs specialist support.
Or your marketing results just aren’t matching your business ambitions.
The truth? You’ve likely tried different approaches.
Maybe multiple agencies. Perhaps expanded your internal team. Tested various channels.
Invested in the latest tools.
Punched into chatgpt “give me marketing ideas to grow my business”…
But something’s still missing.
You’re here because you need more than just another agency. You need a partner who understands your market position, knows how to protect and grow market share, and can align marketing with your business objectives.
That’s exactly why I do things differently at CJ&CO.
My team of 15+ experts brings both strategic insight and tactical excellence.
For some clients, we’re their entire marketing department. For others, I’m a strategic partner supporting internal teams. And for enterprises, we’re a specialist team filling crucial capability gaps.
What makes us different?
We start by understanding your business context. Your market position. Your competitive advantages.
Your operational constraints. And most importantly – your growth objectives.
This isn’t about quick fixes or short-term metrics. It’s about sustainable growth and real business impact.
If you’re seeking a more strategic marketing approach, looking to scale proven channels, needing specialist digital expertise, or wanting better returns from your marketing investment – let’s talk.
Oh and if you’re looking for a team that actually gives a sh*t! That’s us!
The process starts with a super-candid conversation about your business.
Look, I have no idea if I can help. We haven’t even met yet. And while you’re reading about me, I have no idea about you.
That’s why you should scroll down, find one of those big shiny buttons that has a phone number or contact link and reach out.
I’ll tell you straight whether we can or cannot help.
No pitches.
No pressure.
Just straight talk about what’s possible.
Right now, you have two choices: Keep things as they are, or explore what’s possible with a different approach.
The next step is yours.
Last updated 22nd March


We don't want 100s of clients. We want to work with a select few that we cherish like your favourite jumper from Grandma.
We'll deep dive into your business, your competitors, and tell you how Digital Marketing can help your business. Giving you valuable insights via video.
Terms & Conditions apply. Only available for selected businesses.

Speech Clinic
So... You're here. You're a business owner and you want to know what we're going to do, to stuff your pockets with cash and give you the security in life you're looking for.

Are you tired of being stuck in mediocrity while watching your competitors surge ahead? It's time to unlock the power of growth with CJ&CO! Our team of experts is equipped with the skills, strategies, and drive to deliver results that will set your business apart from the competition.
Say goodbye to sluggish lead generation, low conversion rates, and lacklustre profits. With CJ&CO, you can experience a whole new level of growth and success for your business.
Our team has a track record of success, with members having worked on campaigns for big names like Burberry, Nike, Tesco and Indonesia. But, we equally love kicking goals for the little guys. In fact, we thrive on it! We use proven digital marketing strategies to transform businesses and drive growth.
With a 98% retention rate and over $100 million in reported client revenue, it's no wonder why our clients are winning awards and are among the most successful in the business. Join their ranks with CJ&CO. We're the new kid on the block, but growing rapidly. (Just like you want to!)
We offer a full suite of digital marketing services, including advertising, social media marketing, web design and development, copywriting, SEO, email marketing, and more. Our team is dedicated to helping small and medium-sized businesses reach their goals, and we'll work with you to develop a custom plan tailored to your unique challenges.
At CJ&CO, we don't waste your hard-earned dollars on ineffective marketing strategies. Every dollar you spend with us goes straight to work, driving results for your business and boosting your growth. Our solutions are innovative, well-orchestrated, and built to last, so you can rest assured that your investment will continue to pay off for years to come.
Don't settle for mediocrity any longer. Join forces with CJ&CO and experience a whole new level of growth and success! Say goodbye to sluggish lead generation and low conversion rates, and hello to a brighter, more profitable future for your business.
We’re proud to be partnered with some of the biggest businesses on planet earth. Especially those who look after our planet. We lease servers directly from Google and are always on the hunt for the best tools, platforms and services for our clients.


Your brand is your powerhouse, fueling growth and attracting customers. Owning your online presence with a bold digital marketing strategy is crucial for business success. Our consulting services craft and implement a masterful online marketing a plan, leveraging the latest tools and trends to fine-tune your digital machinery. From SEO and Google Ads to targeted campaigns and conversion rate optimisation, we'll help you stay relevant, dive deep, and deliver results in today's competitive market.
Mad marketing consultants crafting strategies to conquer your business & marketing goals! Our digital marketing consulting leverages the latest tools & trends for your success.
Accelerate Your Growth
High-Octane Strategies
Blueprints for Kickass Results
Multi-Step Planning & Forecasting
Hunt down customers on Google, YouTube & Bing with our cutting-edge PPC tactics. Digital marketing experts leveraging the latest tools for your success.
Industry-Crushing Results
YouTube Ads (Elite-Level)
Data-Science Analysis
Multi-Step Planning & Forecasting
We've cracked the code for ultimate social media ad performance. Transforming accounts from zeroes to heroes with our digital marketing tools,strategies and expertise.
Facebook Ads that Slay
Instagram Ads that Rock
TikTok, LinkedIn, Pinterest & beyond
Where your customers chill
Watch your sales & revenue skyrocket with our ecommerce marketing services. Our digital marketing consultants leverage the latest tools & trends for your success.
Full-Throttle Management
Guaranteed to Piss Off Your Rivals (Big Time)
Shopify, Woocommerce, Magento, Neto + more
Generate a relentless torrent of hot leads with our digital marketing strategies. Our experts leverage the latest tools & techniques to our clients &deliver results.
Industry-Crushing Results
Next-Level Integrations & Automations
Supercharged Landing Pages
Sync with your CRM seamlessly
CRO is the key secret ingredient for campaign success. Our digital marketing consultants optimise your website & landing pages to skyrocket conversions.
Relentless Optimisation
Maximise Your Returns
Data-Fueled Decisions
Spend Less, Score More
Be the beacon in Google search results with our SEO services. Digital marketing experts leveraging the latest techniques for your online success.
Traffic Explosion
Conversion Bonanza
SEO Growth Hacks
Harnessing AI
Google Safe
Inside scoop on 5 & 6-figure email campaigns from our digital marketing experts. Leveraging the latest tools & digital marketing trends, to deliver results for your business.
Eye-Popping Designs
Boosts Your Returns
Data-Driven Decisions
We Track Real Results
Spend Less, Reap More
Captivate your audience with genuine, compelling copy. Our digital marketing consultants craft content that resonates & drives action. Leverage our expertise.
High Converting Copy
Short Form & Long Form
Elevate Your Entire Funnel
Transform your website into a jaw-dropping conversion beast with our web design services. Digital marketing experts crafting sites websitesthat deliver results.
Results-Driven Design
Conversion Machines
No Cookie-Cutter Themes
Graphic design service that drives results for your brand. Our digital marketing consultants leverage the latest trends & techniques to create compelling visuals.
Gorgeous Digital Graphics
Pixel-Perfect Print Masterpieces
From Business Cards to Billboards
Modern & Scalable Formats
Navigate business challenges with guidance from our expert coaches. Digital marketing consultants with deep industry knowledge to help business growth.
Profit-First Attitude
Kickass Goals
Epic Results Without Spending a Dime More


Wonderful Indonesia is not just a travel destination, it's a story waiting to be told. Here at CJ&CO, we dove headfirst into this narrative, capturing the soul of Indonesia from Bali to Bintan. This wasn't just about crafting pretty-sounding words, it was about lighting a beacon of hope for a tourism industry hit hard by the pandemic. We focused on the people, the community, the heart of Indonesia, and told the world: "Hey, it's still here, beautiful and warm, just waiting for your return."
Your Brand Is Our Focus.
The Attention You Deserve.
For Less Than Minimum Wage*
No Lock-in Agreements.
Everything You Need.
I'd love to personally chat with you about your goals, business and passions, and how we can develop a plan to achieve your goals.
- Casey Jones
You can find answers to some of the most frequently asked questions regarding Digital Marketing Agencies.
Our goal as a Digital Marketing Agency is simple. Dramatically increase your revenue while retaining or boosting Gross Profits.
We turn website visitors into customers, grow your presence online and help you to dominate your competitors.
A Digital Marketing agency will charge $1000+ per month for their services. This doesn’t include 3rd party costs like, ad spend, servers etc.
Some agencies will charge 5 and even 6 figures per month. This is usually based on retainer + revenue share agreements.
Other agencies may only provide a small subset of services (e.g. a Social Media Marketing Agency). Many of these agencies will charge $1000-$5500 per month.
Full-service agencies typically charge $1500-$20,000+ per month.
Full-Stack = Full Service
Some businesses thrive on social media, some don’t. Some need to generate demand, while others just need to capture it.
We create strategies for the places that will give you the best return on your investment (ROI)
– And yes, that includes traditional mediums like print, radio & TV where beneficial!
There are a few reasons why we’re more affordable than the competition and have better ROIs.
Have more questions? Contact Us.
Feast your eyes on our freshest brain-nuggets, cooked up just for you badass business moguls and marketing mavericks. Dive into the newest musings from our kickass blog. You're welcome.
29 March 2025
Childhood memories are treasures we hold close to our hearts, often reliving them through stories, photos, or cherished keepsakes. However, what if you could…
27 March 2025
Social media has evolved into a video-first space where attention spans are shrinking and competition is fierce. Whether it's Instagram Reels, YouTube Shorts, or…
We love what we do. We love helping business owners take their businesses to the next level. And we love being able to share this feedback with you.
Delivered outstanding results.... Super helpful and outstanding with his communication.
Westy's Pressure Washing
The Parenting Edit
Up until working with Casey, we had only had poor to mediocre experiences outsourcing work to agencies. Casey & the team at CJ&CO are the exception to the rule.
BabyBub
Care Speech Pathology
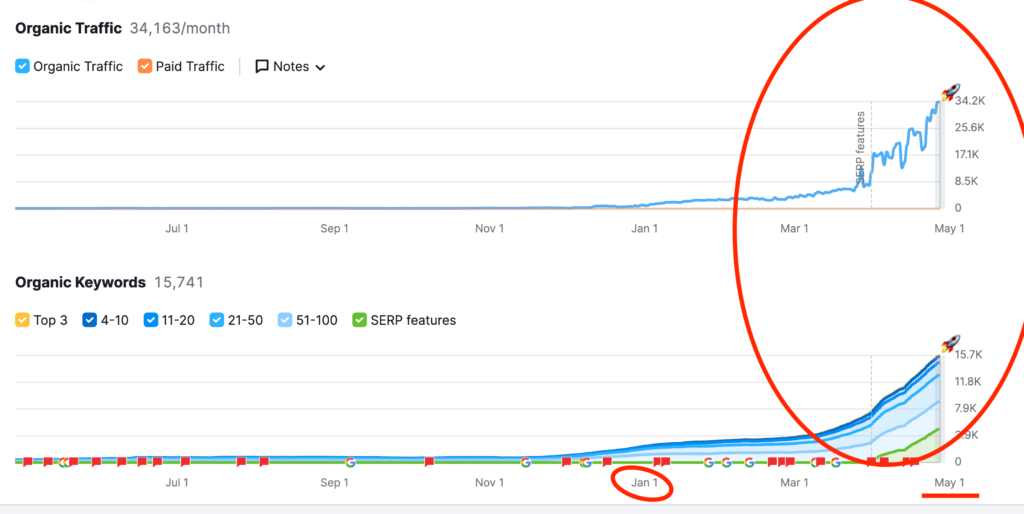
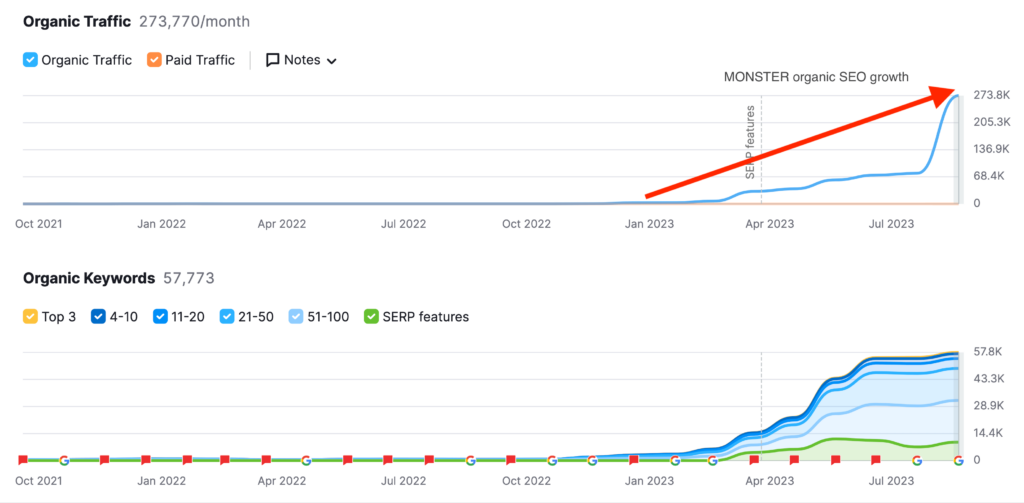
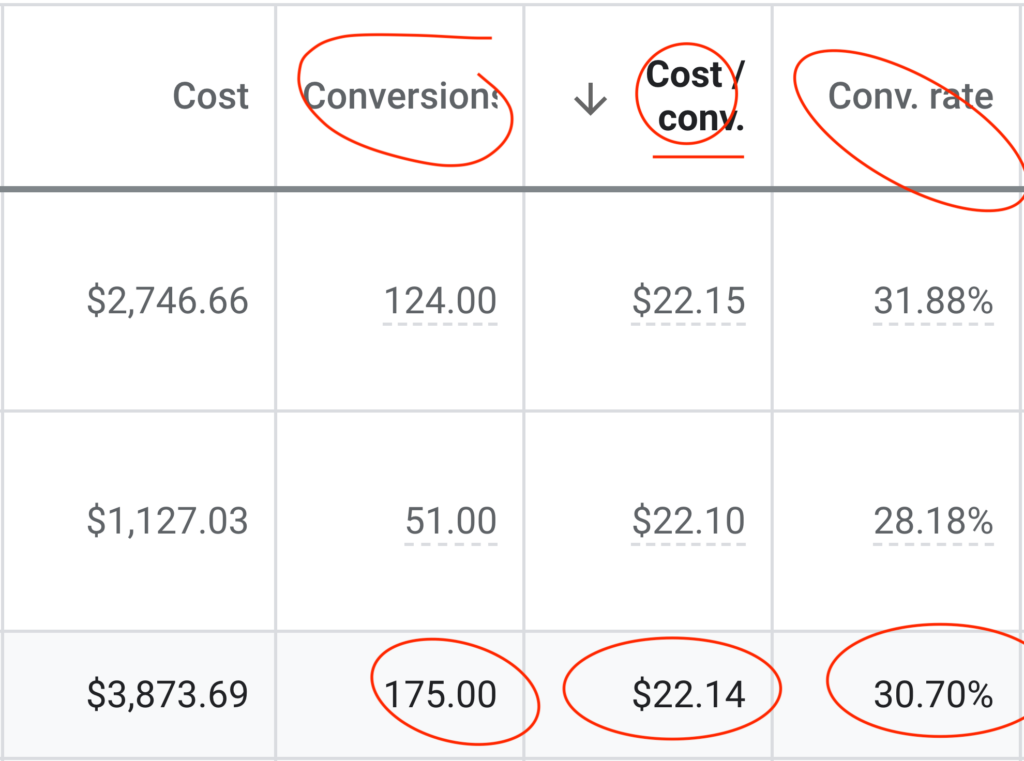
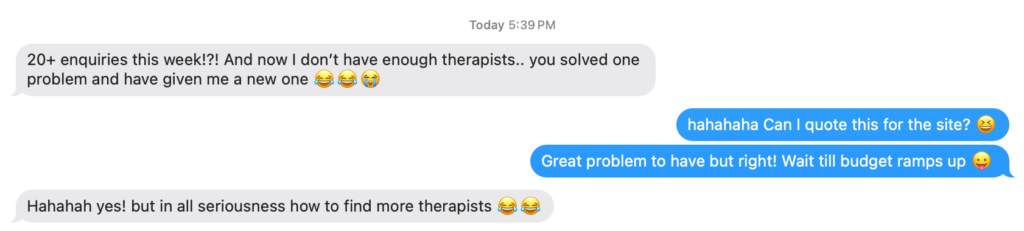
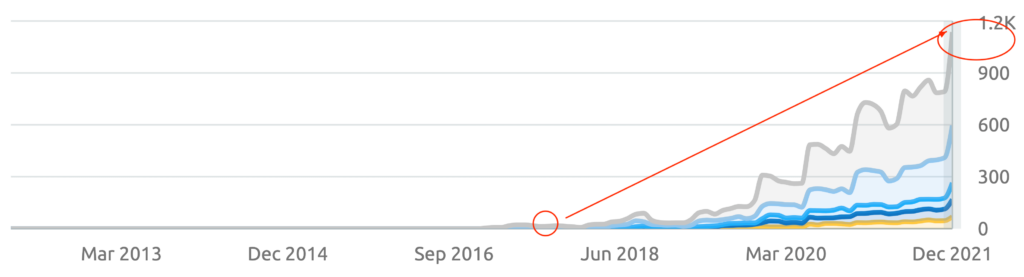
CJ&CO have single-handedly grown my business. We're now turning away $60,000 every week in organic leads. Because, we just don't have the capacity.

Speech Clinic
Wonderful Indonesia
To the insightful marketing behemoth that Casey brings to our whole world of getting in the customers focus zone, once again your insightful strategies always go above and beyond the normality of blanket marketing....
The Audio Tailor
Since going with Casey and his team, we have had nothing but wins! They are great communicators, but more importantly, have got awesome results with low lead costs and have taken the time to really understand our business and our customers. Couldn’t recommend them more highly.
Domain Health
Eclipse Tinting
Extremely happy with Casey and his team. If you're looking for a highly experienced, knowledgeable and ideas-driven marketing agency, look no further.
Care Speech Pathology
Meraki Home Design
Delivered outstanding results.... Super helpful and outstanding with his communication.
Westy's Pressure Washing
The Parenting Edit
Up until working with Casey, we had only had poor to mediocre experiences outsourcing work to agencies. Casey & the team at CJ&CO are the exception to the rule.
BabyBub
Care Speech Pathology
CJ&CO have single-handedly grown my business. We're now turning away $60,000 every week in organic leads. Because, we just don't have the capacity.
Speech Clinic
Eager to turbocharge your business growth? Don't let April sneak up on you. Reach out to us now. We'll take a deep dive into your biz and see if we're the dream team you need to kick ass.


Amazing team with an amazing vision. Executed the website I wanted masterfully! Would definitely recommend them to all small business owners looking to make a statement onlineRead moreRead less
CJCO has truly exceeded my expectations. From the very first interaction, it was clear that their commitment to excellence shines through in every aspect of their work. They handle every detail with care, addressing any concerns or inquiries I had with remarkable responsiveness and genuine accommodation. The end result was nothing short of fantastic, leaving me thoroughly satisfied. I would like to extend my heartfelt gratitude to Casey, Mits, and the entire team for their outstanding efforts. Hats off to all of you!Read moreRead less
As an experienced health professional I am a hard sceptic when is comes to quality services. I was pleasantly surprised when Casey and the ever brilliant Mits on his team over delivered on my project with an A+ website design having actively listened to every point I was seeking, providing an efficient, professional and helpful service. This is an A+ grade gem of a business and is highly recommended.Read moreRead less
Casey, Mits & Team, HATS OFF to the best web developers out there! I could not have asked for a better teamteam to work with, you guys are dedicated to your work and are amazing with your time, consistency effort and love that you pour into what you guys do best! So responsive with communication So Kind and bubbly nature You will know you are in the right hands as soon as you book you appointment with Casey! I am so grateful and thankful for meeting and working with such a great team! THESE GUYS ARE YOUR NUMBER ONE TEAM! THEY ARE GAME ON DONT THINK TWICE! My experience with CJ&Co is far more than 5 Stars DEFINATLYRead moreRead less
Casey helped me in designing a logo for my company. He exceeded my expectations. There was a detailed explanation on each part of the design. They are 100% worth the investment. Casey is easy to talk to and very reliable. He told me it can take up to 10 business days for the logo to be made but it took only 2 days! I'm very impressed. I would love for their team to do my website too. Thank you, Casey and the whole team. I'm very grateful for your help.Read moreRead less
Friendly, easy to work with and high quality production of the website. Would recommend.
Excellent company to deal with and their web design is incredible. Would use them again and again.
Really happy with the website made by the team at CJ&CO! They met our requirements and actioned any feedback promptly and accurately.ely. Casey was very helpful and informative throughout the process. The quality of the website and design is flawless and would highly reccomend CJ&CO for anyone considering website development.Read moreRead less
I am so grateful to Casey and the crew at CJ&CO. I came to them with major issues and Casey helped med me to stay positive. This company is 100% the easiest to deal with and their work is outstanding. I would recommend anyone that comes across this company to don't scroll past without making a call! A++++Read moreRead less
Casey has been an absolute standout! His personalised approach has been nothing short of incredible. We have had amazing results from the get-go and I'd highly recommend Casey and his team to anyone looking for assistance with their digital marketing!Read moreRead less
We have worked with Casey on a number of website projects and are super impressed with his promptness, communication, professionalism, and knowledge of the full suite of digital marketing. Thank you Casey! You and your team are second to none! 🙏Read moreRead less
Casey was so empathetic and patient in listening to my ideas. He asked all the right questions and got me thinking on aspects I hadn't considered. He goes above and beyond. You can trust on him to do the best for your business in the long run. If you want a marketing agency that is truly experienced and REALLY wants to help you grow your business, pick CJ&CO, you won't regret it.Read moreRead less
I engaged CJ&CO to take on marketing my NDIS business recently. Casey and his team have been incredibly positive in their approachoach and patient with my endless questions. I'm looking forward to working with CJ&CO in the future!Read moreRead less
To the insightful marketing behemoth that Casey brings to our whole world of getting in the customers focus zone, once again your insightful strategies always go above and beyond the normality of blanket marketing and get us some enviable results from our competitors and partners alike. Keep up the efforts mate. You are our connection to the customer.Read moreRead less
Up until working with Casey, we had only had poor to mediocre experiences outsourcing work to agencies. Casey & the team atm at CJ&CO are the exception to the rule. Communication was beyond great, his understanding of our vision was phenomenal, and instead of needing babysitting like the other agencies we worked with, he was not only completely dependable but also gave us sound suggestions on how to get better results, at the risk of us not needing him for the initial job we requested (absolute gem). This has truly been the first time we worked with someone outside of our business that quickly grasped our vision, and that I could completely forget about and would still deliver above expectations. I honestly can't wait to work in many more projects together!Read moreRead less
Casey is professional, enthusiastic and knowledgeable. He was quick to identify where we could improve our business, and made a huge impact to our brand. Could not recommend these guys enough!Read moreRead less
Extremely happy with Casey and his team. If you're looking for a highly experienced, knowledgeable and ideas-driven marketing agency, look no further. Not only is Casey exceptionally skilled at creating highly effective marketing strategies and delivering real results, he's a pleasure to work with and a great communicator. He's helped transform our business from a fairly humble start-up to a fast growing and highly regarded service provider in our industry. He knows his stuff and we couldn't be happier. Five Stars.Read moreRead less
The enquiries just keep coming and the business is now unrecognisable. But, what we like most about Casey, is he's a great communicator, really easy to work with and responsive to our needs.Read moreRead less
FIT Merchandising have been using the CJ & Co for about 7 years and love the professionalism , timely turnaround on projectsects , cost structure and all round quality of service we receive form them. Casey is highly skilled in all things digital marketing our brand would be lost with out his and his team.Read moreRead less
CJ&CO has helped me to steadily gain clients so much that I'm now looking at taking on additional staff to meet the the demand.Read moreRead less
I'd highly recommend Casey to business owners who are looking to take that plunge to market their business online.
Within a very short amount of time, the leads coming in the door were AMAZING!
My business is thriving. They developed a new easy to use website for me whilst also managing my Google AdWords account.
I used to enjoy doing my own marketing. Landing leads and cinching clients is a real endorphin rush. However, it was very hit or miss. One day, something changed and after almost $300 in Facebook ad spend, I didn’t land a single lead. I couldn’t figure it out and got referred to CJ&CO from a fellow OT. Within a month, with Casey's short-term strategy, the leads were rolling in!Read moreRead less